https://sqltouch.blogspot.com/2014/03/free-real-time-sql-server-performance.html
FREE: Real-time SQL Server Performance Monitor - Extreme visibility to SQL Server database engine
CTE, using Temporary Table, using Table varable, Count(*), Data compression, AlwayON, covering Index, resolve deadlock, Automatic Page repair
sqltouch.blogspot.com
Download:.............. http://bit.ly/2NTn6Zi
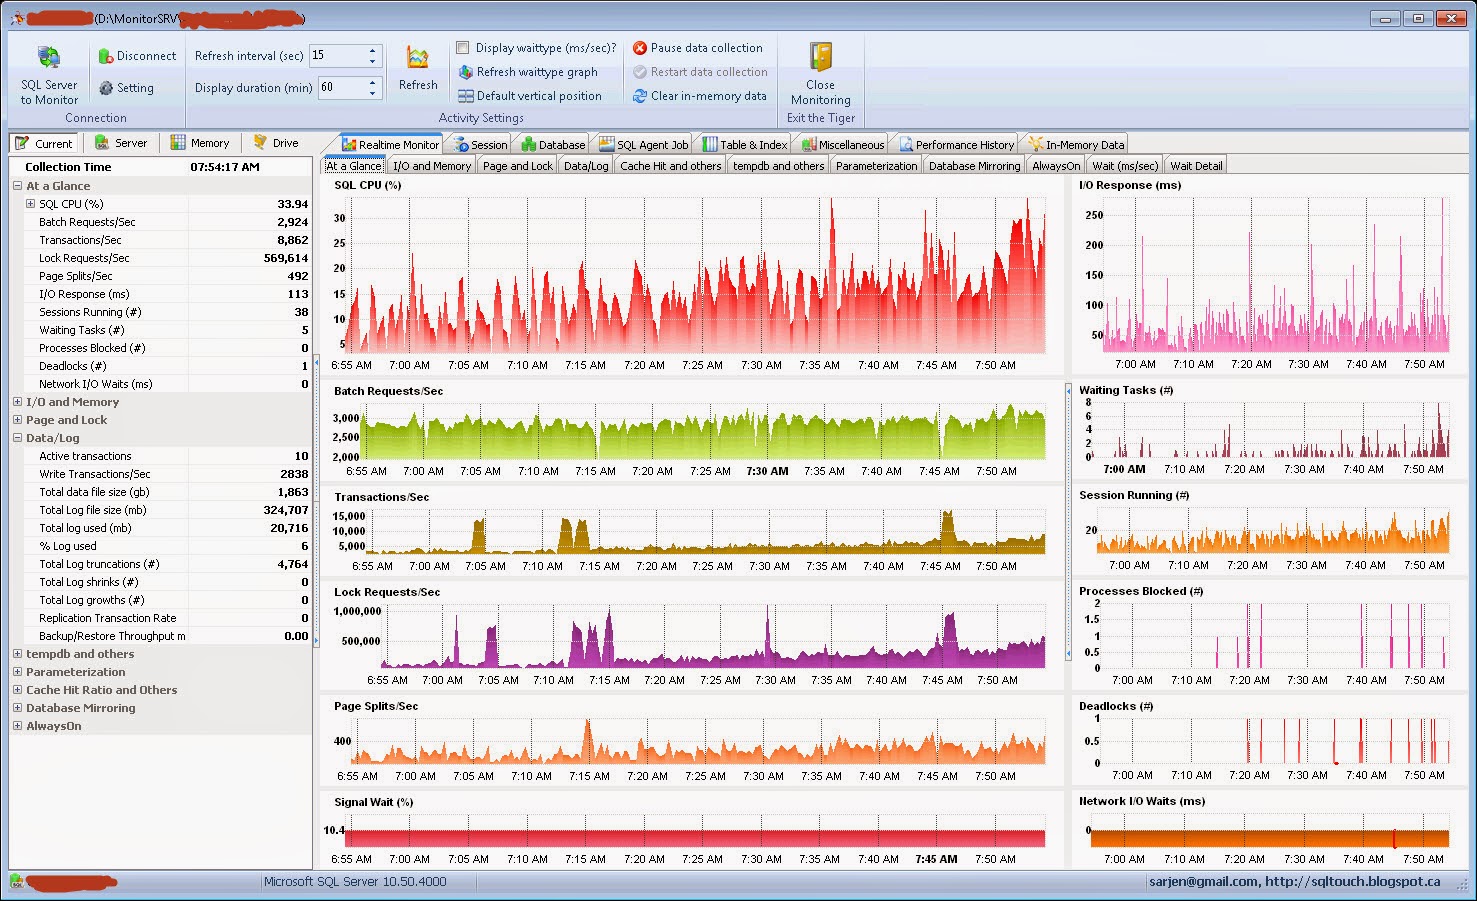
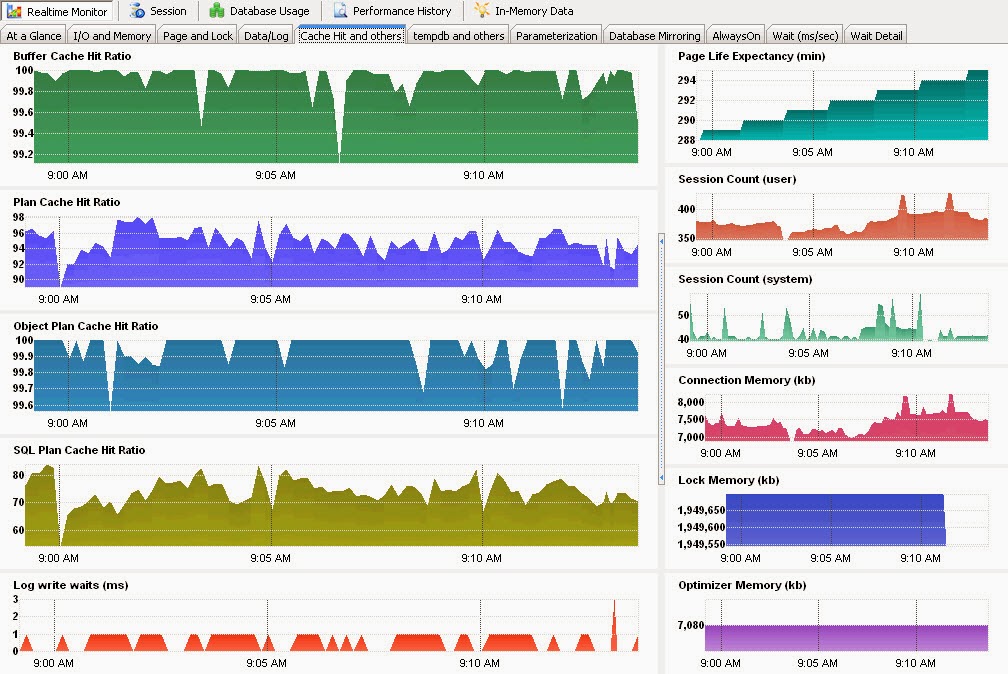
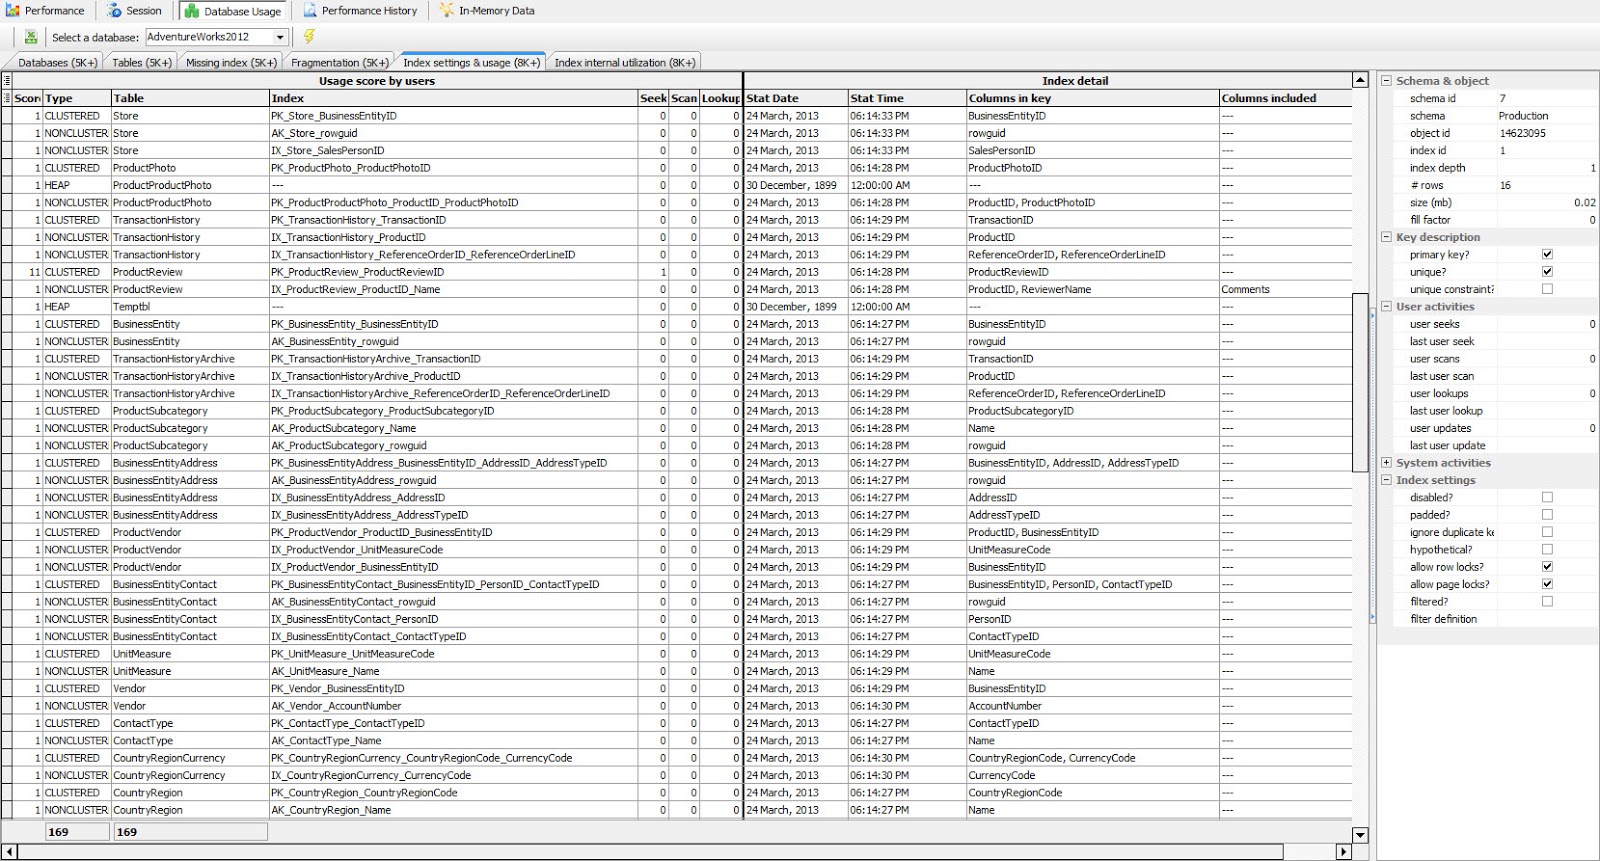
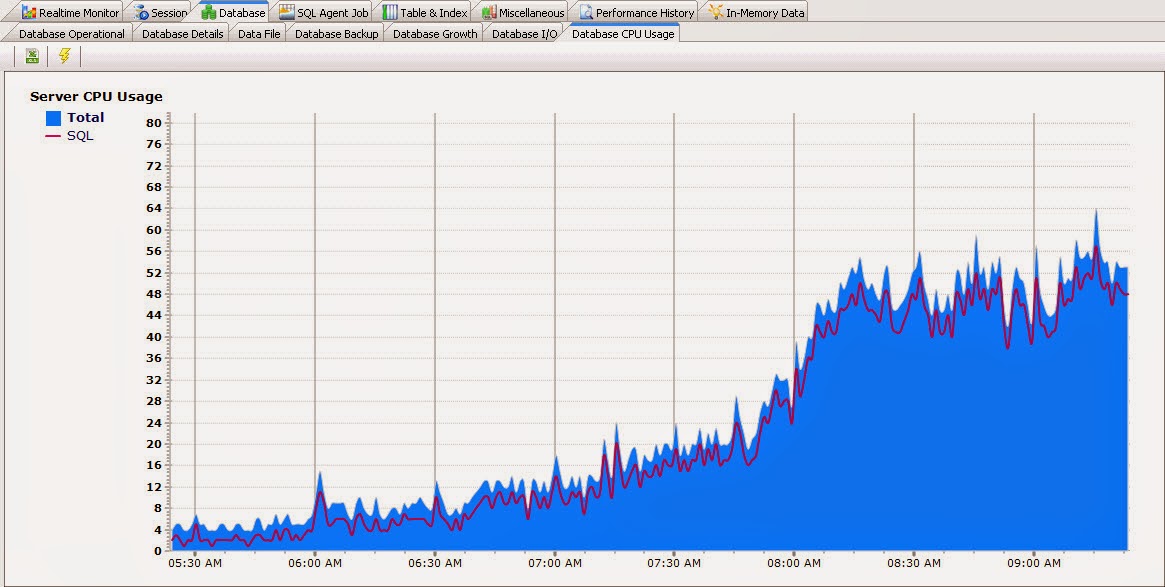
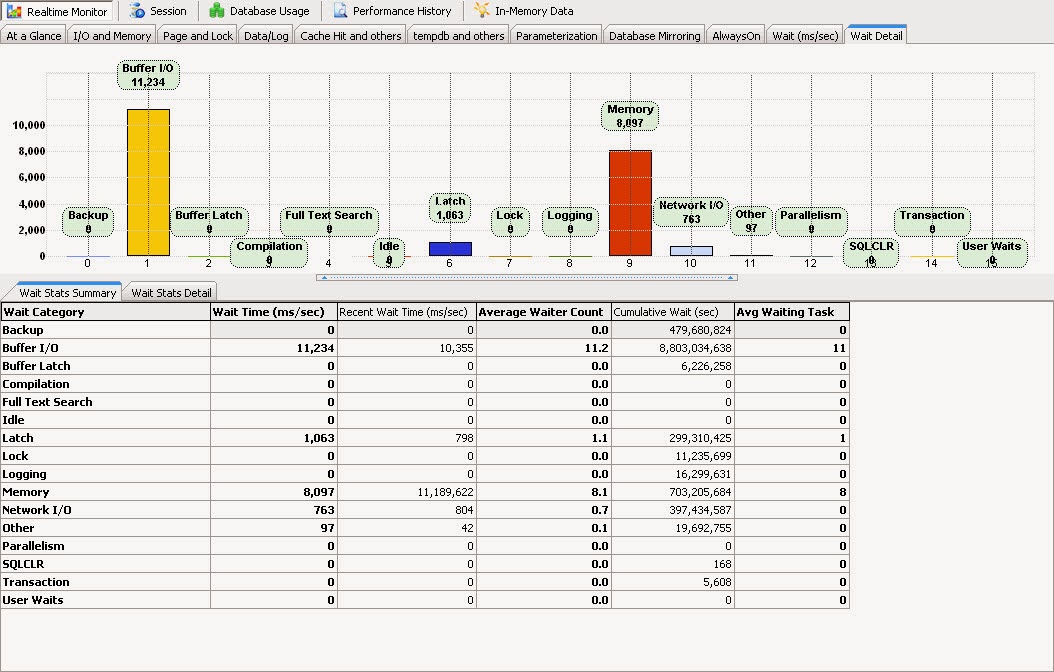
A challenge:
Retrieving and visualizing the SQL Server performance data is always a challenge and a tedious task for SQL Server database professionals. Utilizing the Windows PerfMon application is the easiest way to perform this task as well as querying “sys.dm_os_performance_counters” and some other DMVs brings a lot of useful information.
Starting from SQL Server 2005, Microsoft has introduced DMV to query various internal metadata directly to explore various health status data. Although collecting and analyzing SQL Server performance data in a regular basis provides trending ability, monitoring real-time performance data is critical to understand an ongoing performance condition that is occurring.
We are all familiar with built-in “SQL Server Activity Monitor” and obviously it is a good starting point to troubleshoot some SQL Server issues. However, the capacity of this tool is limited as it does not provide other performance metrics which are important to understand the server health status. To extend this idea especially during a performance condition, I have attempted to develop a “SQL Performance Monitor” desktop app by including some other interesting metrics which I believe might be helpful to troubleshoot or understand a problem.
This tool collects more than 50+ performance data directly from SQL Server in real-time and shows data in the chart continuously. Also, it does not require any installation and configuration.
Data collection:
SQL Scripts used in my tool are excerpted from SSMS and some are collected from various forums which are freely available. My understanding is that all the scripts that I have used are reliable however if any are not working, please let me know and I will attempt to fix the issue.
How does it work?
1. Has the ability to monitor only a single SQL instance at a time and can be used against all editions of SQL Server from 2005 to SQL 2014.
3. Performance data will be saved automatically as they are collected in a SQLite database (sqlmonitor.db3).
4. All saved performance data can be queried, and then can be exported as a CSV format. As “sqlmonitor.db3” is not protected therefore it can be opened with any SQLite tool.
Limitations:
1. It has no notification system, such as email, alert, popup.
2. It is a desktop 32-bit application, cannot run as a service.
3. Chart colors have no special meaning.
Known Limitations:
(a) SQL 2005 – in the “Server Info” tab the “Available Memory” will be zero.
(b) CPU utilization has been calculated from “Resource Pool” and @@CPU_BUSY. Due to the internal limitation of SQL Server, and feature limitation of Standard and Express editions, CPU value may show zero on the chart. In Enterprise edition, CPU utilization will not be zero.
How to run:
Connect to a database server:
The tool bar of “SQL Performance Monitor”
Figure#1: Tool bar of SQL Activity Monitor

First time connection:
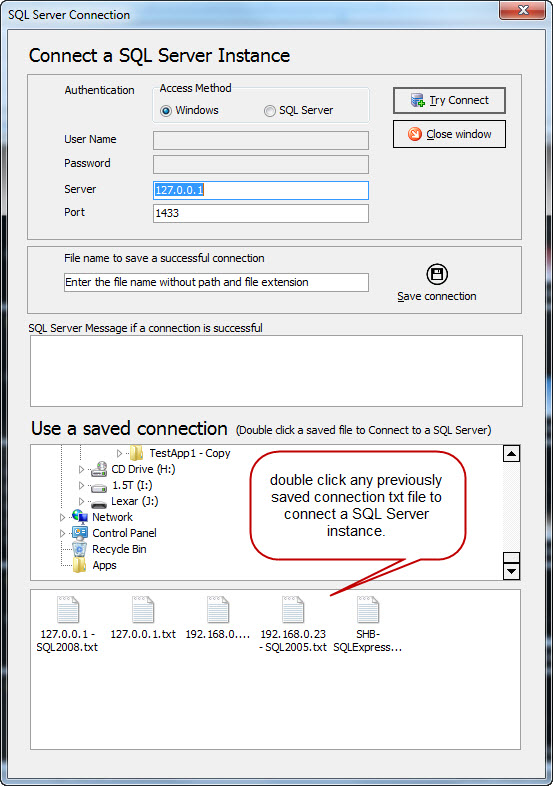
To connect a SQL Server instance, click the “SQL Server to Monitor” button. Supply the required information and then click “Try Connect” in the connection dialog box. Once connected, close the connection dialog box or choose another server to connect to.
All charts will be populated for an hour with blank data once a connection is made. It continues to collect and display data based on the duration configured on the tool bar. All collected data will be saved in a SQLite database (sqlmonitor.db) for later review and analysis.
Using a saved connection:
A successful connection can be saved for later use. Once the tool successfully connects to a database server, click the “save connection” button to save the connection string. An encoded text file will be created in the same folder with the “.txt” extension where the “SQLMonitor.exe” resides.
From the bottom list box of the “SQL Server Connection” (figure#2) dialog box, double click a previously saved file to connect to a SQL Server instance.
Couple of Screenshots from “SQL Performance Monitor”
Figure#2: SQL Server Connection dialog
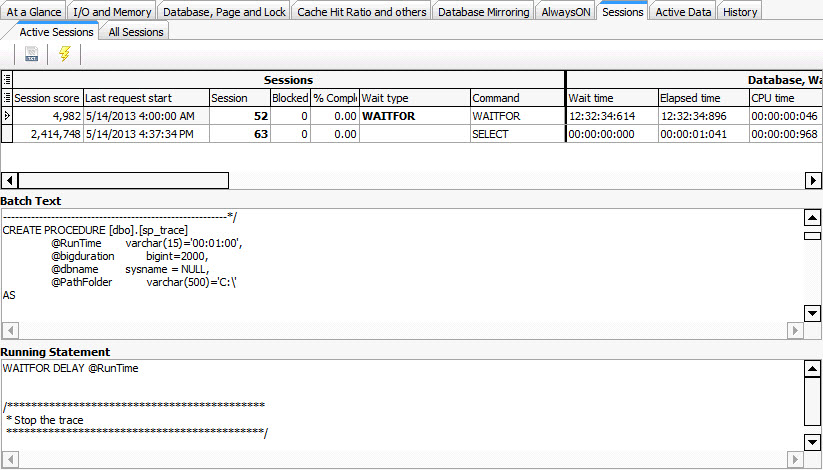
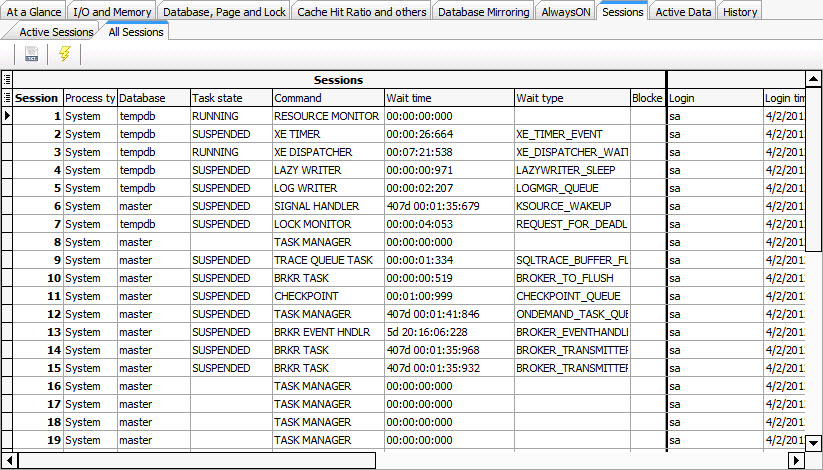
Figure#3B: Viewing all sessions
Historical data:
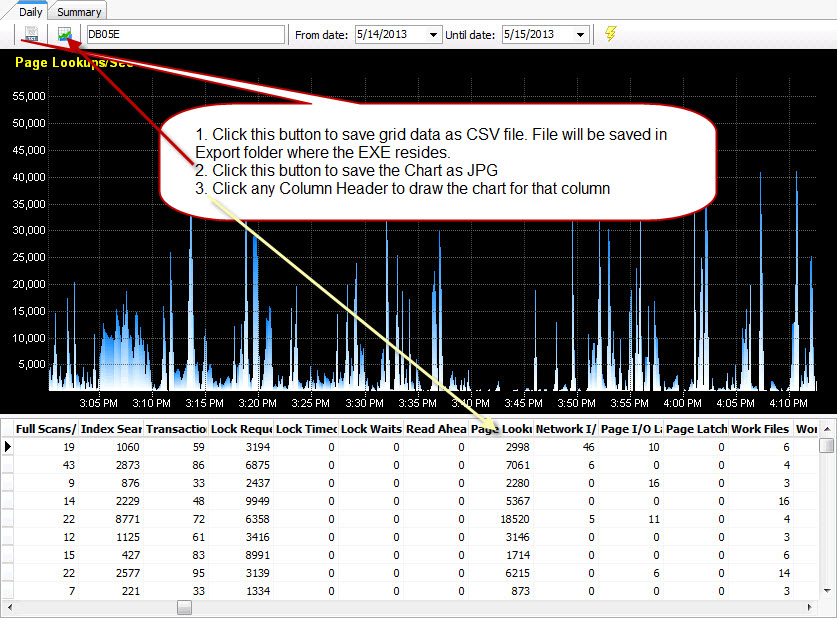
In the history tab, put “SQL Instance Name” and “date” to query historical data. Click any column header to view data in the chart. All data and charts can be saved.
Figure#4: Historical data browse

Figure#5: Summarizing historical data

'Database > SQL Server' 카테고리의 다른 글
| AlwaysOn 구성환경에서 Server Role 체크 후 Job Agent 실행 중지하기 (0) | 2023.02.14 |
|---|---|
| 임의의 쿼리를 HTML 테이블로 바꾸는 동적 프로시저 (0) | 2022.10.13 |
| database size (0) | 2022.05.25 |
| 쿼리 (0) | 2021.12.08 |
| MERGE 문 사용법 (DUAL, UPDATE와 INSERT를 한번에) (0) | 2021.07.08 |